


Pain provocation tests are recommended for assessing pain severity and as an outcome measure for individuals with patellar tendinopathy.
ObjectiveTo evaluate floor and ceiling effects, sensitivity to change, and responsiveness cut-offs of two provocative load tests among athletes with patellar tendinopathy.
MethodsAthletes (N = 41) performed six repetitions for the single leg decline squat (SLDS) and resisted knee extension (KE) at baseline and 12 weeks. Participants rated their pain during each test on a visual analog scale (VAS). Sensitivity to change was assessed by calculating effect size (ES) and the standardized response mean (SRM). The responsiveness cut-offs were assessed using a combination of anchor and distribution- based methods to determine the minimal clinically important difference (MCID) for each test.
ResultsA floor or ceiling effect was observed in only a small number of participants for both tests except for KE, for which approximately one third of participants had a floor effect at week 12. There was higher sensitivity to change for SLDS (ES: 1.93/SRM: 1.43) compared with KE (ES:0.96/SRM: 1.09). The MCID corresponded to a decrease of 1.6 points for SLDS and 1.0 for KE, while the distribution-based method estimated 1.2 points for SLDS and 1.1 for KE.
ConclusionThis study found moderate to high sensitivity to change and established MCID values for the SLDS and KE test in athletes with patellar tendinopathy before and after rehabilitation. Both tests may be useful as pain on loading outcomes as athletes progress with their rehabilitation, but the KE test results in higher floor effects and has lower sensitivity to change.
Patellar tendinopathy (PT) is a common overuse injury, characterized by load-related pain and dysfunction in the patellar tendon. It is most common in athletes who participate in sports involving repetitive knee extensor mechanism loading, like volleyball, basketball, and soccer.1 Clinical PT diagnosis is based on the symptom history and physical examination.2 Clinically, PT presents localized pain at the patellar inferior pole which is aggravated by energy storage and release activities such as jumping, landing, or fast change of direction.3 Additionally, imaging (ultrasound or magnetic resonance) is frequently used to confirm tendon pathology, and it can be especially helpful to exclude other anterior knee pain sources, such as patellofemoral pain.4–6
Provocative loading tests are commonly used to identify individuals experiencing patellar tendon pain. Pain provocation tests, like the single-leg decline squat (SLDS), performed on a decline board are recommended for assessing pain severity and as an outcome measure.7–10
Biomechanical studies have demonstrated that patellar tendon force significantly increases during single‐leg squats at decline angles >15°.11,12 Another potential provocative test is a single knee extension (KE); to date, there has been no investigation of open kinetic chain exercise clinically used for individuals with patellar tendon pain assessment. This exercise specifically loads the quadriceps muscle and patellar tendon and the load can be easily increased when using a knee extension machine. A recent international consensus process recommended pain with activity/loading (such as provocative load tests) as a core outcome for tendinopathy13 so it is important to investigate the measurement properties of this group of measures.
It is not clear which provocative loading testing is the most suitable for these scenarios use as an outcome measure among athletes with patellar tendon pain. As well as being reliable and valid, appropriate tests should not have substantial ceiling (many people scoring the maximum pain level) or floor effects (many people scoring no pain), and should demonstrate sensitivity to change and responsiveness. Sensitivity to change is defined as the test detecting change regardless of what this change means.14 In contrast, responsiveness is defined as the test detecting change that is meaningful.15 This is often referred to as the minimal clinically important difference (MCID). There are anchor and distribution-based methods for estimating the MCID which is “the smallest change in score in the domain of interest which patients perceive as beneficial and which would mandate, in the absence of troublesome side effects and excessive cost, a change in the patient's management”.16 Anchor-based methods require an external, independent indicator to “anchor” the meaning of clinical importance, one that is itself interpretable and at least moderately correlated with the test or measure.17 In contrast, distribution-based methods use a set statistic based on the distribution, for example 50 % of the standard deviation, as a proxy for the MCID. Comparing both anchor and distribution-based methods will facilitate a more complete understanding of provocative load test responsiveness properties for PT.
The applicability of test that guide the clinical PT diagnosis have not been evaluated as to whether they can be used as outcome scores. The purpose of this study was to evaluate floor and ceiling effects, sensitivity to change, and the MCID of two tests which are used in people with PT.
MethodsStudy designThis study is a secondary analysis of data from a randomized controlled trial that investigated the efficacy of inertial flywheel (N = 21) or heavy slow resistance exercises (N = 21) on pain and function in athletes with PT at 12 weeks.18 Following verbal explanation of the testing procedures and risks to each participant, they provided oral and written informed consent. Approval for this project was obtained from the Ethics Committee at the Hospital Nacional de Clínicas, Córdoba, Argentina (N° 3365).
ParticipantsFemale and male participants were included if they were > 18 years of age, participated in sport (specifically volleyball, basketball, soccer, or running) at least three times per week, had self-reported pain in the patellar tendon region for ≥3 months and had a clinical PT diagnosis made by a sports physical therapist (DR) with 16 years of experience. Diagnosis was made based on the pain being localized at the inferior pole of the patella and being aggravated by activities involving high patellar tendon loads (jumping, sprinting, change of direction), a score of less than 80 points on the Victorian Institute of Sport Assessment Patella (VISA-P), and tendon pathology identified on ultrasound imaging (hypoechoic regions on grey-scale and with or without Doppler signal).2 Ultrasound imaging was performed by a blinded experienced musculoskeletal radiologist.
Athlete participants were excluded if they reported any other knee injury or prior surgery on the affected side, corticosteroid injections within the 6 months prior to testing, osteoarthritis of any joint in the lower limb that required management, diabetes mellitus, rheumatological or inflammatory disease, or any other condition that could affect the participant's understanding of the procedures or performance during the intervention, such as neurological disease or cognitive impairments.
Participant's characteristics including pain duration and severity, level of activity prior to injury, and ultrasound imaging findings were collected at baseline prior to provocative load testing. The VISA-P questionnaire was completed with no assistance to assess pain severity and function.19 The VISA-P score ranges from 0 to 100: 100 being a completely asymptomatic and unrestricted ability to play sports. Scores below 80 were associated with symptomatic PT.20,21 The MCID of the VISA-P was considered to be 13 points.22
Randomization and interventionsIn the main trial,18 participants were randomly assigned to the inertial flywheel or heavy slow resistance groups according to a blind allocation strategy using a computer-generated random number table. Both groups completed three exercise sessions in a fitness center per week with at least one day of rest in between. All sessions lasted approximately 50 min in total (including a standardized 10-min warm-up: cycling and dynamic mobility exercises) and they were supervised by the lead researcher (DR) or an assistant physical therapist. The heavy slow resistance program was performed according to the protocol previously described by Kongsgaard et al23 and it included leg squat, leg press, and hack squat performed on commercial exercise machines.23 The inertial flywheel program included squat, leg press, and knee extension performed on three inertial flywheel machines.
Pre-test procedureGiven that patellar tendon pain may be influenced by prior activity, athletes were asked not to undertake exercise, sports, or strenuous activity on the testing day, except for incidental walking. Prior to performing either test, all athletes received information about the procedure. This meant that all participants had a standardized 10–15 min period of sitting prior to the load tests. Following this, a 10-min warm-up (cycling and dynamic mobility exercises) was performed by participants in a fitness center.
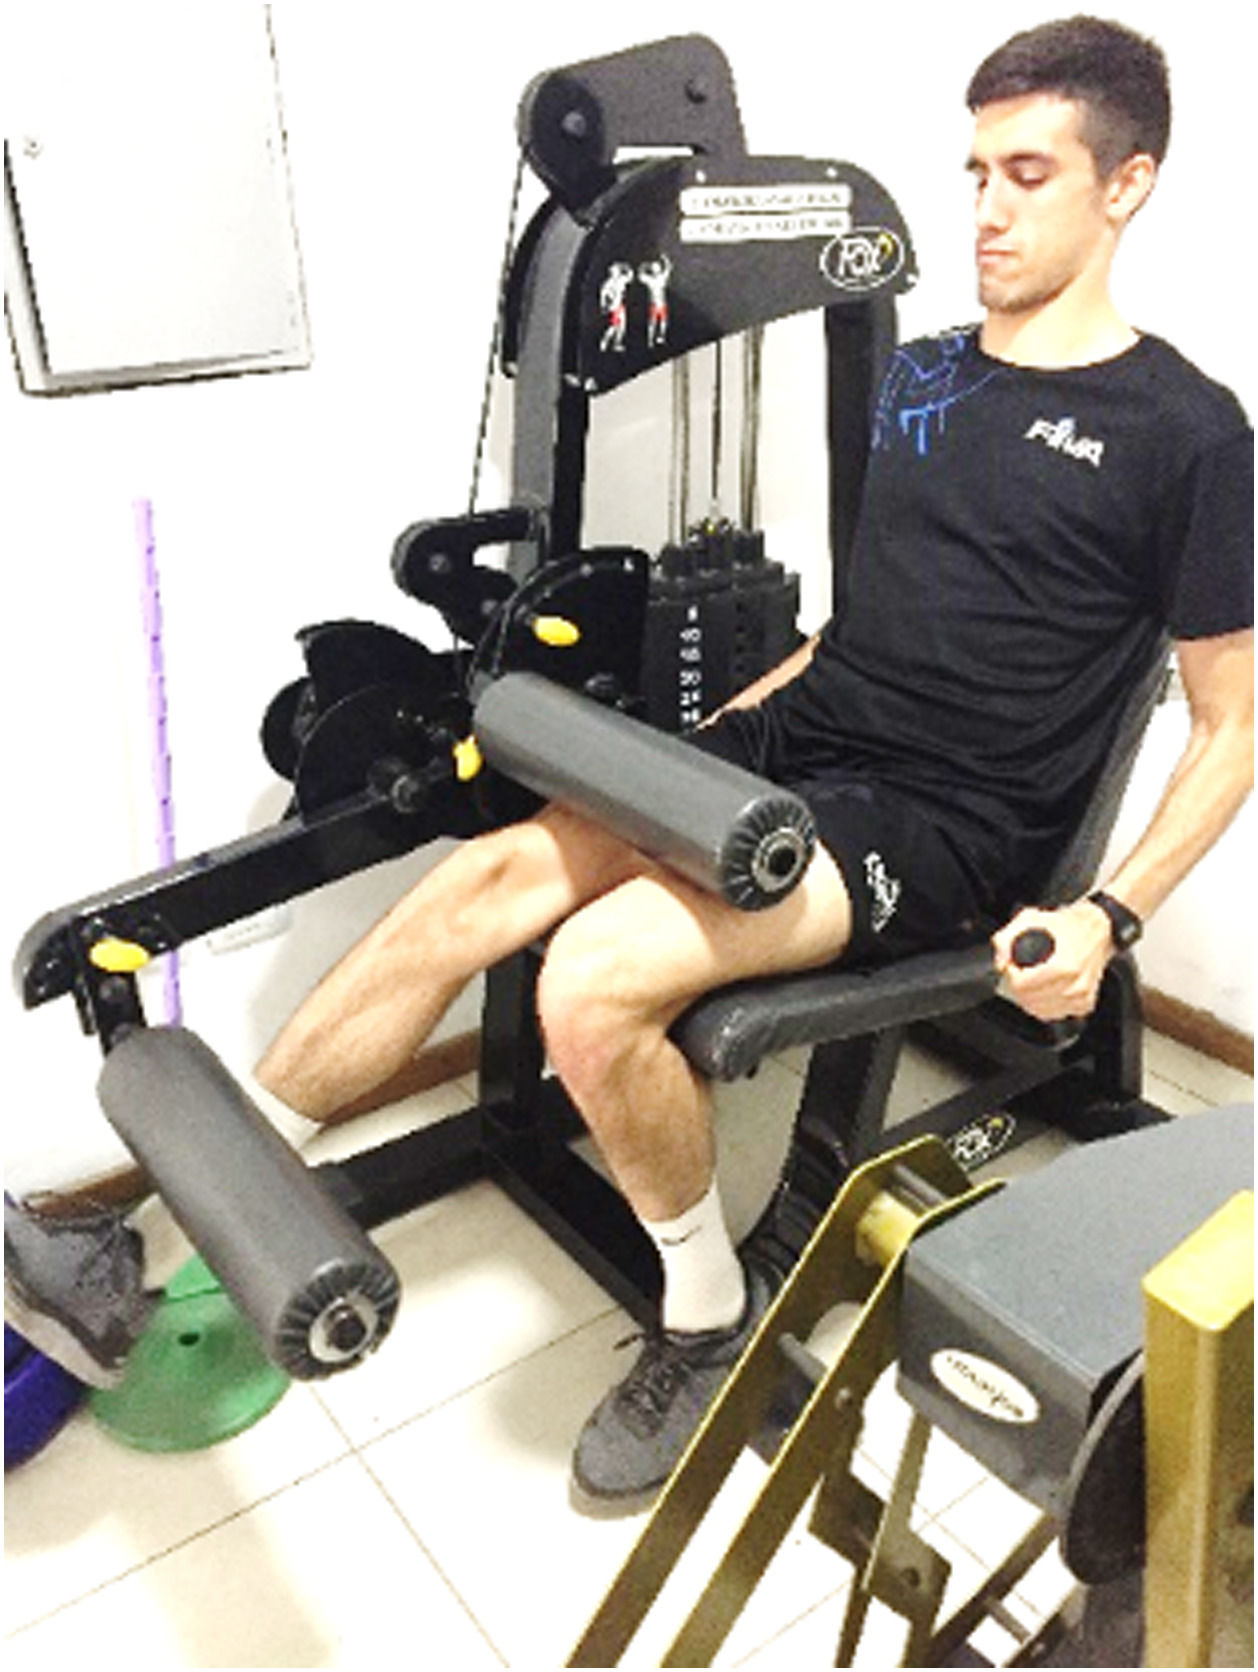
Pain provocation testsBoth tests were performed prior to and after completing a 12-week strength training program. Participants were instructed to complete 6 repetitions each of SLDS and KE on a leg extension machine (Fox, Buenos Aires, Argentina). Each participant was instructed to report their pain experienced during each test on a visual analogue scale (VAS, 0–100, 0 = no pain, 100 = worst pain imaginable).24 No test familiarization was performed to minimize the potential for a change in pain or fatigue.25 All participants received standardized instructions and an examiner (DR) provided a technique and pacing demonstration of each test. Verbal feedback was provided during the performance of the SLDS on a 25° decline board to ensure the movement was performed at the appropriate speed (2 s per repetition) and body position (0° to 60° knee flexion with upright trunk) (Fig. 1).10
.")
Knee extension was executed with mass equivalent to 50 % of the participant's body mass set up during knee extension, from 90° to 0° knee flexion with each repetition performed in approximately 2 s (Fig. 2).
Statistical analysis.")
All analyses were undertaken using the statistical software R version 4.1.226 and the type 1 error rate was set at 5 %. Descriptive statistics for participants’ demographic data were inspected for normality using the Shapiro–Wilk test. Parametric data are presented as means and standard deviations. If data were not normally distributed, the median and IQR was reported.
The floor and ceiling effects were calculated as sample percentages scoring the minimum (0) and the maximum (10) possible scores on the VAS at baseline and after SLDS and KE test intervention. Ceiling and floor effects equal or greater to 15 % were considered significant.27
Paired t-tests were used to determine whether there was a change in VAS score for each of the two tests. Effect size and standardized response mean were used to calculate sensitivity to change. Effect size was calculated as the change score (difference between the VAS before and after the strength training program divided by the standard deviation of scores at baseline).28 The standardized response mean was calculated as the difference in scores by the standard deviation of the change scores.29 Effect size and standardized response mean were interpreted as small (<0.5), moderate (0.5 to 0.8), and large effect (>0.8).30,31 The percentile bootstrap method32 (10,000 replications) was used to calculate confidence intervals (95 %) for effect size and standardized response mean.
A combination of anchor and distribution-based methods were used to determine MCID for each test. All participants were stratified into responders and non-responders based on whether the VISA-P score changed by ≥13 points or not.22 The anchor-based method used the mean of the difference between VAS scores of non-responders and responders. One-half (0.5) of the standard deviation measurement was used as the distribution-based criterion in this study.33
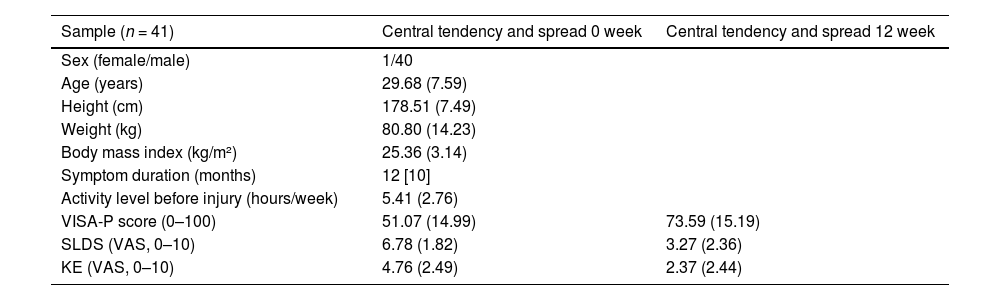
ResultsForty male and one female participants (age: 29.68 (7.59) years, weight: 80.80 (14.23) kg, height: 178.51 (7.49) cm) were included in the study (Table 1).
Participant demographic and clinical characteristics at baseline.
Abbreviations: VISA-P, Victorian Institute of Sport Assessment-Patella; SLDS, single leg decline squat; KE, knee extension; VAS, visual analogue scale. Higher score means worse outcome for SLDS and KE VAS. Values are reported as mean (SD) except for symptom duration which is median [IQR].
A floor or ceiling effect was observed in only a small number of participants for both tests. With the KE test, one third of participants (14/41) had a floor effect when measured after the intervention (Table 2).
Total and percentages for floor and ceiling effect from baseline to 12 weeks for the total sample.
Abbreviations: SLDS, single leg decline squat; KE, knee extension; 0, 0 week; 12, 12 week.
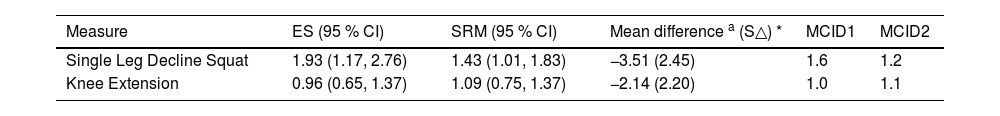
There was a statistically significant improvement in pain (VAS) after the intervention as measured with the SLDS (p < 0.001) and KE (p < 0.001) tests. The SLDS was more responsive (effect size: 1.93/standardized response mean: 1.43) compared to KE (effect size: 0.96/standardized response mean: 1.09) test, demonstrating a large within-group change.
The MCID corresponded to a 1.6-point decrease for SLDS and 1.0 for KE with the anchor-based method, compared to 1.2 points for SLDS and 1.1 for KE with the distribution-based method (Table 3). When examined on the anchor-based method, a larger number of participants (35/41) showed changes in MCID for SLDS, and approximately half (23/41) showed improvement when KE was used. When examined on the distribution-based method, we obtained the same proportions: 35/41 showed changes in MCID for the SLDS and 23/41 showed improvement with KE.
Sensitivity to change and minimal clinically important difference of the provocative test for the total sample.
| Measure | ES (95 % CI) | SRM (95 % CI) | Mean difference a (S△) * | MCID1 | MCID2 |
|---|---|---|---|---|---|
| Single Leg Decline Squat | 1.93 (1.17, 2.76) | 1.43 (1.01, 1.83) | −3.51 (2.45) | 1.6 | 1.2 |
| Knee Extension | 0.96 (0.65, 1.37) | 1.09 (0.75, 1.37) | −2.14 (2.20) | 1.0 | 1.1 |
Abbreviations: ES, effect size; MCID, minimal clinically important difference; MCID1, anchor-based method; MCID2, distribution-based method; SRM, standardized response mean; S△ = Standard deviation of change score.
Our findings indicated moderate to high sensitivity to change and established MCID values for the SLDS and KE test in athletes with PT before and after an exercise training program.
Floor and ceiling effectsWe observed very low levels of floor and ceiling effects for both the KE and SLDS provocative load tests. The only exception to this was that 34 % of the cohort achieved no pain (flooring) with the KE test at the 12-week outcome time. This suggests that the KE test is less provocative than the SLDS test. This result might be because KE exercise was performed in the inertial flywheel protocol, so this load test was specific to one of the prescribed exercises. Therefore, the KE test may be a more appropriate option if the SLDS test is too provocative for individuals with elevated pain levels. One further consideration is that we used 50 % of bodyweight with the KE test, future studies may use higher load levels which may be more provocative. Finally, it is important to note that the sensitivity to change was also lower with the KE test. Taken together with the greater floor effects, these data suggest that people started with lower pain scores which decreased at the end of the intervention. Only a third of participants ended up with no pain after a 12-week period. Therefore, this indicates that the SLDS may be generally more suitable (more sensitive to change and less floor effects).
Sensitivity to changeWe found that there were large effect size and standardized response mean for both the SLDS and KE load tests. This indicates that both tests have shown capacity to measure relevant or meaningful changes after the exercise therapy interventions.16–34 The standardized response mean and effect size are commonly used to evaluate sensitivity to change, however, when they are discrepant the standardized response mean method may be more appropriate because it is calculated as a variability function of change scores over time rather than at baseline. For example, the SLDS test showed a lower standardized response mean compared with effect size. This is explained by greater variability within group change compared with baseline variability within group (the denominators of standardized response mean and effect size, respectively). This demonstrates that dividing the change scores by within group variance is more representative of how participants change over time. In contrast, there was similar sensitivity to change estimates with both statistics for KE. So, in this instance either value may be used.
Responsiveness cut-offs (MCID)The MCID for VAS scores during the SLDS and KE tests were similar for both estimation method used (anchor or distribution-based). Although the magnitude of improvement in pain was small, clinicians can use this score to determine whether there has been an improvement in people with PT after a 12-week exercise therapy intervention. Nevertheless, these results should be interpreted with caution. Despite the VISA-P questionnaire being commonly used as the anchor measure, the validity of this instrument has recently been questioned.35 Concerns have been raised about the internal reliability which may lead to variability in outcome.36
Comparison with other studiesTo our knowledge, no prior studies have examined sensitivity to change of the MCID for provocative load tests for people with PT. However, our results are partly consistent with previous studies that established a 1-point MCID on the numerical pain rating scale (NPRS) (0 = no pain and 10 = worst possible pain) in an 825-patient cohort with diverse chronic musculoskeletal pain.37 In another study, the MCID on the NPRS was estimated to be 2 points for subjects with varying diagnoses including diabetic neuropathy, postherpetic neuralgia, chronic low back pain, fibromyalgia, and osteoarthritis.38 In patients with shoulder pain, a 2.17-point MCID on the NPRS was estimated after a 3–4 week rehabilitation period.39 A review for patients with shoulder pain established MCID values in the range of 1.5 points on a 10-point scale (or 15 points on a 100-point scale) for pain, and 10 points on a 100-point scale for function or disability, consistent with the results of the present study.40 There are prior studies that have used the SLDS as an outcome measure that we can compare. Rio et al41 investigated the effectiveness of the isometric squat exercise using a portable belt on patellar tendon pain in athletes during a competitive season for 4 weeks. Average reduction in pain on the SLDS (0 to 10 point scale) was 3.5 points while in our study it was 3 which is greater than the MCID that we identified in our study (1.6). The effect size was smaller than the current study (0.58 vs 1.93).
In another study, Agergaard et al42 evaluated the effects of slow moderate resistance or heavy slow resistance on clinical outcomes and reported a 2-point improvement on pain on the SLDS from baseline to 12 weeks for both groups. Based on our MCID finding, these studies demonstrate what appears to be clinically important benefits with exercise for the SLDS measure.
Strengths and limitationsThe strengths of this study are that it reports novel MCID estimates for load tests that have been recommended as core outcomes for people with PT. Given that sensitivity to change and responsiveness are dependent on group characteristics, it is also an advantage that we included a homogenous population based on characteristic including symptom duration, severity, and activity level before injury.
When interpreting these study results, a few limitations need to be considered. First, this study was based on a modest sample size and the findings should be validated using a larger sample. Additionally, it is unknown if the results are generally applicable and if they have clinical implications, as these findings come from secondary analyses of data from a clinical trial rather than a primary psychometric study. Second, samples consisted of volunteer athletes with PT who performed a 12-week gym-based exercise program; so our sensitivity to change findings may be specific to this context. Third, we used the VISA-P as an anchor to determine MCID for the anchor-based method. It is recommended to use global outcomes, such as global rating of change43 because they are more likely to include changes and improvements that are not detected by more specific measures (i.e. the VISA-P assesses pain, disability, and activity) and consider the participants’ perspectives. Finally, the tests were administered only at baseline and 12 weeks; so sensitivity to change and MCID at other timepoints remain to be investigated.
ConclusionThis study found moderate to high sensitivity to change and established MCID values for the SLDS and KE test in athletes with PT tested before and after a 12-week exercise training program. Both tests may be useful to assess pain on loading as athletes progress with their rehabilitation, but the KE test has higher floor effects and lower sensitivity to change.


